library(readr)
library(dplyr)
library(tibble)
library(tidyr)
library(purrr)
library(stringr)
library(ggplot2)
library(tidymodels)
library(textrecipes)
library(glmnet)
library(quanteda)

source("R/inaugural-corpus.R")
paragraphs <- inaugural_paragraphs()

split_study <- read_csv(
  "data/inaugural/split-study.csv",
  na = "NA",
  col_types = cols(
    task = col_character(),
    split_scheme = col_character(),
    replicate = col_integer(),
    accuracy = col_double(),
    bal_accuracy = col_double(),
    train_majority_accuracy = col_double(),
    test_majority_rate = col_double(),
    length_rule_accuracy = col_double(),
    test_rows = col_integer(),
    test_speeches = col_integer()
  )
)

baselines <- read_csv(
  "data/inaugural/baselines.csv",
  na = character(),
  col_types = cols(
    task = col_character(),
    outcome = col_character(),
    rows = col_integer(),
    speeches = col_integer(),
    people = col_integer(),
    largest_class = col_character(),
    baseline_accuracy = col_double()
  )
)

era_counts <- paragraphs |>
  count(era, name = "paragraphs")

era_evidence <- split_study |>
  filter(task == "era", split_scheme == "speech") |>
  summarise(
    speech_split_accuracy = mean(accuracy),
    split_minimum = min(accuracy),
    split_maximum = max(accuracy),
    split_spread = split_maximum - split_minimum,
    deployable_baseline = mean(train_majority_accuracy),
    length_rule_accuracy = mean(length_rule_accuracy),
    replicates = n(),
    .groups = "drop"
  )

era_baseline_metadata <- baselines |>
filter(task == "era")Classifying documents
Follow the text-classification recipe on inaugural paragraphs
classification
text classification
inaugural corpus
Learn how a text classifier represents documents, fits a model, returns probabilities, and needs a cut point.
Elena has a box of labelled speeches and a simple question for the archive search page. Could a paragraph’s vocabulary help sort it into a broad time period?
A classifier can find differences in wording without explaining history, policy, or people. This lesson uses the inaugural corpus only for technical practice with vocabulary features.
TipWhat you will learn
By the end of this lesson, you will be able to:
- name the four steps in a text-classification recipe.
- compare token counts with term frequency-inverse document frequency.
- read a baseline beside a model score.
- examine a probability distribution.
- explain why a cut point is a separate choice.
Represent the text
Text classification has four steps:
- Represent the text.
- Fit a model.
- Predict a score.
- Choose the score threshold for each label.
A feature is an input column for the model. Here the features are words after tokenization.
Two common representations are token counts and term frequency-inverse document frequency, often shortened to tf-idf. A count records how often a word appears. tf-idf gives less weight to words that appear in many documents.
set.seed(5101)
speech_split <- group_initial_split(
  paragraphs,
  group = speech_id,
  prop = 0.75,
  strata = era
)
era_train <- training(speech_split)
era_test <- testing(speech_split)

fit_era_model <- function(use_tfidf = TRUE, max_tokens = 500L) {
  model_recipe <- recipe(era ~ paragraph, data = era_train) |>
    step_tokenize(paragraph) |>
    step_tokenfilter(paragraph, max_tokens = max_tokens)

  if (use_tfidf) {
    model_recipe <- model_recipe |>
      step_tfidf(paragraph)
  } else {
    model_recipe <- model_recipe |>
      step_tf(paragraph)
  }

  workflow() |>
    add_recipe(model_recipe) |>
    add_model(
      logistic_reg(penalty = 0.01, mixture = 1) |>
        set_engine("glmnet") |>
        set_mode("classification")
    ) |>
    fit(data = era_train)
}

set.seed(5102)
era_tfidf_fit <- fit_era_model(use_tfidf = TRUE, max_tokens = 500L)

set.seed(5103)
era_count_fit <- fit_era_model(use_tfidf = FALSE, max_tokens = 500L)

score_era_model <- function(fitted_workflow) {
  probability_table <- predict(fitted_workflow, era_test, type = "prob")
  late_column <- names(probability_table)[str_detect(names(probability_table), "later")]

  era_test |>
    select(paragraph_id, era) |>
    bind_cols(probability_table, predict(fitted_workflow, era_test)) |>
    mutate(prob_1900_or_later = .data[[late_column]])
}

tfidf_scores <- score_era_model(era_tfidf_fit)
count_scores <- score_era_model(era_count_fit)

feature_comparison <- tibble(
  representation = c("tf-idf, 500 tokens", "token counts, 500 tokens"),
  accuracy = c(
    yardstick::accuracy(tfidf_scores, truth = era, estimate = .pred_class) |>
      pull(.estimate),
    yardstick::accuracy(count_scores, truth = era, estimate = .pred_class) |>
      pull(.estimate)
  )
)

feature_gap <- abs(diff(feature_comparison$accuracy))

score_feature_split <- function(split_seed) {
  set.seed(split_seed)
  replicate_split <- group_initial_split(
    paragraphs,
    group = speech_id,
    prop = 0.75,
    strata = era
  )
  replicate_train <- training(replicate_split)
  replicate_test <- testing(replicate_split)

  fit_replicate_model <- function(use_tfidf, fit_seed) {
    replicate_recipe <- recipe(era ~ paragraph, data = replicate_train) |>
      step_tokenize(paragraph) |>
      step_tokenfilter(paragraph, max_tokens = 500)

    if (use_tfidf) {
      replicate_recipe <- replicate_recipe |>
        step_tfidf(paragraph)
    } else {
      replicate_recipe <- replicate_recipe |>
        step_tf(paragraph)
    }

    set.seed(fit_seed)
    workflow() |>
      add_recipe(replicate_recipe) |>
      add_model(
        logistic_reg(penalty = 0.01, mixture = 1) |>
          set_engine("glmnet") |>
          set_mode("classification")
      ) |>
      fit(data = replicate_train)
  }

  tfidf_fit <- fit_replicate_model(use_tfidf = TRUE, fit_seed = split_seed + 1000L)
  count_fit <- fit_replicate_model(use_tfidf = FALSE, fit_seed = split_seed + 2000L)

  bind_rows(
    tibble(
      representation = "tf-idf, 500 tokens",
      accuracy = yardstick::accuracy(
        bind_cols(replicate_test |> select(era), predict(tfidf_fit, replicate_test)),
        truth = era,
        estimate = .pred_class
      ) |>
        pull(.estimate)
    ),
    tibble(
      representation = "token counts, 500 tokens",
      accuracy = yardstick::accuracy(
        bind_cols(replicate_test |> select(era), predict(count_fit, replicate_test)),
        truth = era,
        estimate = .pred_class
      ) |>
        pull(.estimate)
    )
  ) |>
    mutate(split_seed = split_seed, test_rows = nrow(replicate_test))
}

feature_replicates <- bind_rows(
  feature_comparison |>
    mutate(split_seed = 5101L, test_rows = nrow(era_test)),
  map(5102:5105, score_feature_split) |>
    list_rbind()
) |>
  relocate(split_seed)

feature_summary <- feature_replicates |>
  summarise(
    mean_accuracy = mean(accuracy),
    minimum = min(accuracy),
    maximum = max(accuracy),
    spread = maximum - minimum,
    .by = representation
  )

feature_gaps <- feature_replicates |>
  select(split_seed, representation, accuracy) |>
  pivot_wider(names_from = representation, values_from = accuracy) |>
  mutate(gap = abs(`token counts, 500 tokens` - `tf-idf, 500 tokens`))

test_counts <- era_test |>
count(era, name = "paragraphs")| Representation | Accuracy on this split |
|---|---|
| tf-idf, 500 tokens | 0.8799 |
| token counts, 500 tokens | 0.8949 |
| Representation | Mean accuracy | Minimum | Maximum | Spread |
|---|---|---|---|---|
| tf-idf, 500 tokens | 0.8381 | 0.7632 | 0.8799 | 0.1167 |
| token counts, 500 tokens | 0.8477 | 0.7690 | 0.8966 | 0.1275 |
On this split, token counts score 0.8949 and tf-idf scores 0.8799. The gap is 0.0150.
With the same model settings across five speech-level splits, tf-idf ranges from 0.7632 to 0.8799. Token counts range from 0.7690 to 0.8966. The displayed gap is smaller than those same-configuration ranges. These results do not establish that token counts perform better than tf-idf. The model reads the supplied feature table rather than paragraphs directly.
A linear model with word-count features also loses word order. It can learn that a word is common in one class and rare in another. Detecting adjacent words requires features that encode adjacency.
Examine the probability scores
The model returns probabilities rather than final actions. The usual 0.50 threshold is a convention. A project can choose a different threshold if the two errors have different costs.
probability_summary <- tfidf_scores |>
  summarise(
    minimum = min(prob_1900_or_later),
    tenth = quantile(prob_1900_or_later, 0.10),
    median = median(prob_1900_or_later),
    ninetieth = quantile(prob_1900_or_later, 0.90),
    maximum = max(prob_1900_or_later),
    .groups = "drop"
)| Minimum | 10th percentile | Median | 90th percentile | Maximum |
|---|---|---|---|---|
| 0.024 | 0.1394 | 0.8629 | 0.9928 | 1 |
Show the plotting code
source("R/lesson-figures.R")

era_colours <- c(
  "before 1900" = lesson_colours[["contrast"]],
  "1900 or later" = lesson_colours[["accent"]]
)

ggplot(tfidf_scores, aes(x = prob_1900_or_later, fill = era)) +
  geom_histogram(
    binwidth = 0.05,
    boundary = 0,
    colour = lesson_colours[["paper"]],
    show.legend = FALSE
  ) +
  geom_vline(
    xintercept = 0.5,
    linetype = "22",
    colour = lesson_colours[["muted"]]
  ) +
  facet_wrap(
    vars(era),
    ncol = 1,
    labeller = as_labeller(\(era) str_c("Recorded era: ", era))
  ) +
  scale_fill_manual(values = era_colours) +
  scale_x_continuous(
    breaks = seq(0, 1, by = 0.25),
    labels = scales::label_number(accuracy = 0.01)
  ) +
  labs(
    title = "Scores concentrate near different scale endpoints for the two recorded eras",
    subtitle = "Test paragraphs by predicted probability of the 1900-or-later label. The dashed line marks 0.50.",
    x = "Predicted probability for 1900 or later",
    y = "Paragraphs"
  ) +
  theme_lesson(grid = "y")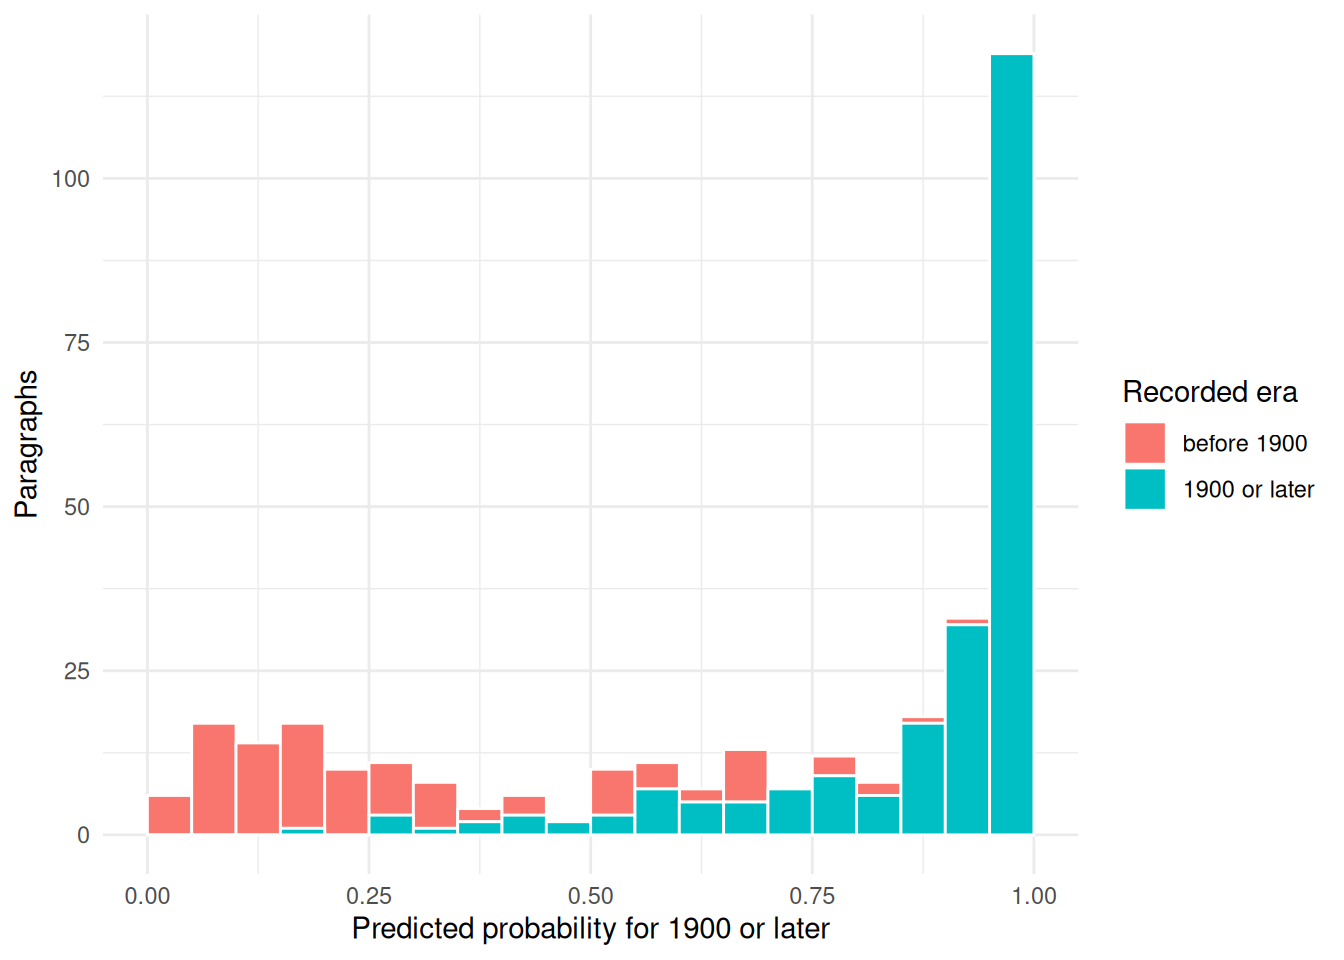
Many scores are near 0 or 1. The median is 0.8629. The later era is the larger class in this test split, and the model gives most later-era paragraphs high scores. Both facts make the median high. This lesson does not measure the separate effect of each fact.
Class imbalance means that one class has more rows than another. The train-majority baseline gives every test row the label of the larger training class. With class imbalance, that rule labels many rows correctly without using the text.
Choose the cut point
A different threshold changes which labels the model assigns to uncertain cases. The team must choose that threshold for its task. The fitted model does not make the decision alone.
era_thresholds <- tibble(threshold = c(0.40, 0.50, 0.60)) |>
  mutate(
    results = map(threshold, \(cut_point) {
      tfidf_scores |>
        summarise(
          before_1900_sent_late =
            sum(prob_1900_or_later >= cut_point & era == "before 1900"),
          late_sent_before =
            sum(prob_1900_or_later < cut_point & era == "1900 or later"),
          .groups = "drop"
        )
    })
  ) |>
unnest(results)| Cut point | Earlier paragraphs sent to later label | Later paragraphs sent to earlier label |
|---|---|---|
| 0.4 | 31 | 7 |
| 0.5 | 28 | 12 |
| 0.6 | 17 | 22 |
At 0.40, seven later-era test paragraphs have scores below the threshold. At 0.60, that count increases to 22 while fewer earlier paragraphs receive the later label. A classifier returns a score. A person chooses the threshold for the task.
Where prompting a language model fits
A general language model can also classify text from written instructions without training rows. This method is useful when labelled examples are scarce or categories change often. Published comparisons often find that trained models match or exceed prompting performance with a few hundred labelled examples for a stable task. Those models can also cost less and produce more consistent output across runs.
Score both methods on the same held-out rows. Display the baseline beside their scores. Record the prompt and model revision as part of the method. The guide Using a language model in a reproducible analysis shows how.
What to remember
- Text classification needs labelled documents and a fixed set of categories.
- The representation step decides which text evidence the model can see.
- A baseline gives the model score a reference point.
- Class imbalance can make easy guesses look better than they are.
- Word-count models ignore order unless order is built into the features.
- Compare prompting and trained models on the same held-out rows.
Sources
- quanteda inaugural corpus documentation
- glmnet package documentation
- textrecipes package documentation
- Edwards and Camacho-Collados (2024), Language models for text classification: is in-context learning enough?
- Bucher and Martini (2024), Fine-tuned small LLMs (still) significantly outperform zero-shot generative AI models in text classification (preprint)