suppressPackageStartupMessages({
  library(readr)
  library(dplyr)
  library(tidyr)
  library(tibble)
  library(stringr)
  library(ggplot2)
  library(rsample)
  library(recipes)
  library(textrecipes)
  library(parsnip)
  library(workflows)
  library(yardstick)
  library(broom)
  library(glmnet)
})

study <- read_csv(
  "data/inaugural/split-study.csv",
  na = c("", "NA"),
  col_types = cols(
    task = col_character(),
    split_scheme = col_character(),
    replicate = col_integer(),
    accuracy = col_double(),
    bal_accuracy = col_double(),
    train_majority_accuracy = col_double(),
    test_majority_rate = col_double(),
    length_rule_accuracy = col_double(),
    test_rows = col_integer(),
    test_speeches = col_integer()
  )
)

baselines <- read_csv(
  "data/inaugural/baselines.csv",
  na = character(),
  col_types = cols(
    task = col_character(),
    outcome = col_character(),
    rows = col_integer(),
    speeches = col_integer(),
    people = col_integer(),
    largest_class = col_character(),
    baseline_accuracy = col_double()
  )
)

split_levels <- c("paragraph", "speech", "president")
task_levels <- c("era", "era_party_rows", "party")

task_labels <- c(
  era = "era",
  era_party_rows = "era on party rows",
  party = "party"
)

split_summary <- study |>
  mutate(
    task = factor(task, levels = task_levels),
    split_scheme = factor(split_scheme, levels = split_levels)
  ) |>
  group_by(task, split_scheme) |>
  summarise(
    replicates = n(),
    mean_accuracy = mean(accuracy),
    mean_bal_accuracy = mean(bal_accuracy, na.rm = TRUE),
    bal_accuracy_missing = sum(is.na(bal_accuracy)),
    mean_train_majority = mean(train_majority_accuracy),
    mean_test_majority = mean(test_majority_rate),
    mean_length_rule = mean(length_rule_accuracy),
    low_accuracy = min(accuracy),
    high_accuracy = max(accuracy),
    low_train_majority = min(train_majority_accuracy),
    high_train_majority = max(train_majority_accuracy),
    low_length_rule = min(length_rule_accuracy),
    high_length_rule = max(length_rule_accuracy),
    mean_test_speeches = mean(test_speeches),
    .groups = "drop"
  ) |>
  arrange(task, split_scheme)

baseline_display <- baselines |>
  mutate(task = factor(task, levels = task_levels)) |>
  arrange(task) |>
  transmute(
    task = recode(as.character(task), !!!task_labels),
    rows,
    speeches,
    people,
    largest_class,
    baseline_accuracy
)Evaluating models
Read a score only after asking what it was compared with
model development
evaluation
text classification
Learn why model evaluation needs a baseline, repeated splits, and a split scheme that matches the claim.
A program manager sees a model accuracy of 61 percent. She asks how an always-majority prediction would compare.
The model’s accuracy does not establish useful performance if a simpler rule achieves the same result.
This lesson reads a committed split study for three related text models. The era model performs better than simple alternatives. The party model, with these features and this fixed penalty, does not consistently predict party correctly.
TipWhat you will learn
This lesson shows how to:
- separate candidate selection, the final test, and robustness checks.
- compare every score with a deployable largest-class baseline.
- read the spread across repeated train/test splits.
- explain what paragraph, speech, and person splits measure.
- use a confusion matrix and balanced accuracy.
- say when a specific model did not learn the target.
Start with the baseline
A baseline is a simple rule against which the team evaluates a model. The largest-class baseline always predicts the most common training label. Its simplicity makes it a useful comparison. A model that cannot improve on that rule does not demonstrate useful performance.
| Task | Rows | Speeches | People | Largest class | Corpus baseline |
|---|---|---|---|---|---|
| era | 1377 | 60 | 40 | 1900 or later | 0.6478 |
| era on party rows | 1197 | 47 | 31 | 1900 or later | 0.7452 |
| party | 1197 | 47 | 31 | Republican | 0.6065 |
The era task has 1377 rows, 60 speeches, and 40 people. The party model can train only on rows with a Democratic or Republican label, so it uses 1197 rows from 47 speeches by 31 people. The remaining rows come from other party labels. Each task also selects its own 500 tokens from its own training data.
Selection, the final test, and robustness do different jobs
Lesson 43 compared candidate settings with five grouped folds from the training speeches. After fixing the candidate and penalty, it used the 14 untouched test speeches once. That final test evaluates the modeling decision within this worked example. Transfer to another collection requires evaluation on a new corpus.
The study below creates new splits 10 times to show how scores vary with the allocation of speeches. These holdouts provide a robustness check on sensitivity to the split. They are not 10 new untouched test sets. Lesson 43 did not use them to choose its candidate.
Accuracy is the share of rows with the right label. When classes are uneven, a model can get many rows right by favoring the larger class. A confusion matrix shows which labels were confused, and balanced accuracy averages the accuracy within each class so the smaller class still counts.
Repeated splits change the answer
The study creates 10 replicates for each task and split scheme. A replicate is a new split made with the same rule. The mean describes the centre of the results. The minimum and maximum show the range across the 10 runs.
Unlike five-fold cross-validation, repeated holdout does not guarantee that each speech appears in exactly one test set. Here it measures sensitivity to the split and plays no part in model selection.
score_table <- split_summary |>
  transmute(
    task = recode(as.character(task), !!!task_labels),
    split_scheme = as.character(split_scheme),
    mean_accuracy = round(mean_accuracy, 4),
    mean_bal_accuracy = round(mean_bal_accuracy, 4),
    train_majority_accuracy = round(mean_train_majority, 4),
    test_majority_rate = round(mean_test_majority, 4),
    length_rule_accuracy = round(mean_length_rule, 4),
    low_accuracy = round(low_accuracy, 4),
    high_accuracy = round(high_accuracy, 4),
    missing_bal_accuracy = bal_accuracy_missing
  )

get_summary <- function(task_name, scheme_name) {
  split_summary |>
    filter(task == task_name, split_scheme == scheme_name)
}

era_speech <- get_summary("era", "speech")
era_president <- get_summary("era", "president")
era_party_speech <- get_summary("era_party_rows", "speech")
era_party_president <- get_summary("era_party_rows", "president")
party_paragraph <- get_summary("party", "paragraph")
party_speech <- get_summary("party", "speech")
party_president <- get_summary("party", "president")

na_replicate <- study |>
  filter(task == "era_party_rows", split_scheme == "president", is.na(bal_accuracy))

era_speech_range_width <- era_speech$high_accuracy - era_speech$low_accuracy

era_speech_length_gap <- era_speech$mean_accuracy - era_speech$mean_length_rule

era_party_speech_gap <- era_party_speech$mean_accuracy - era_party_speech$mean_train_majority

paired_comparisons <- bind_rows(
  study |>
    filter(task == "era", split_scheme == "speech") |>
    summarise(
      comparison = "era, all rows",
      model_wins = sum(accuracy > train_majority_accuracy),
      ties = sum(accuracy == train_majority_accuracy),
      model_losses = sum(accuracy < train_majority_accuracy)
    ),
  study |>
    filter(task == "era_party_rows", split_scheme == "speech") |>
    summarise(
      comparison = "era, party rows",
      model_wins = sum(accuracy > train_majority_accuracy),
      ties = sum(accuracy == train_majority_accuracy),
      model_losses = sum(accuracy < train_majority_accuracy)
    ),
  study |>
    filter(task == "party", split_scheme == "paragraph") |>
    summarise(
      comparison = "party, paragraph split",
      model_wins = sum(accuracy > train_majority_accuracy),
      ties = sum(accuracy == train_majority_accuracy),
      model_losses = sum(accuracy < train_majority_accuracy)
    )
)

party_president_bal_range <- range(
  study$bal_accuracy[
    study$task == "party" &
      study$split_scheme == "president"
  ]
)| Task | Split | Model accuracy | Balanced accuracy | Training-majority rule | Test-majority rate | Length rule | Model low | Model high | Missing balanced accuracy |
|---|---|---|---|---|---|---|---|---|---|
| era | paragraph | 0.8661 | 0.8617 | 0.6464 | 0.6464 | 0.6652 | 0.8406 | 0.9043 | 0 |
| era | speech | 0.8457 | 0.8516 | 0.6282 | 0.6712 | 0.6827 | 0.7970 | 0.9039 | 0 |
| era | president | 0.8354 | 0.8206 | 0.6185 | 0.6266 | 0.7184 | 0.7543 | 0.8782 | 0 |
| era on party rows | paragraph | 0.8473 | 0.8059 | 0.7433 | 0.7433 | 0.6057 | 0.8233 | 0.8833 | 0 |
| era on party rows | speech | 0.8240 | 0.7641 | 0.8086 | 0.8086 | 0.5931 | 0.7362 | 0.8810 | 0 |
| era on party rows | president | 0.8521 | 0.8143 | 0.8284 | 0.8284 | 0.6871 | 0.8094 | 0.9033 | 1 |
| party | paragraph | 0.6060 | 0.5887 | 0.6067 | 0.6067 | 0.5077 | 0.5700 | 0.6400 | 0 |
| party | speech | 0.5514 | 0.5408 | 0.6563 | 0.6806 | 0.4148 | 0.4561 | 0.6055 | 0 |
| party | president | 0.4997 | 0.5090 | 0.4914 | 0.6173 | 0.4308 | 0.4158 | 0.5631 | 0 |
| Comparison | Higher model accuracy | Equal accuracy | Lower model accuracy |
|---|---|---|---|
| era, all rows | 10 | 0 | 0 |
| era, party rows | 6 | 0 | 4 |
| party, paragraph split | 3 | 1 | 6 |
The speech split is the main era test. The model averages 0.8457, while the deployable majority rule averages 0.6282 and the paragraph-length rule averages 0.6827. The model’s lowest speech-split replicate is 0.797, which is still higher than the best mean reached by either simple rule. Across the 10 speech replicates, the model ranges from 0.797 to 0.9039. The deployable rule ranges from 0.3576 to 0.8318, and the length rule ranges from 0.5255 to 0.8498.
Compare a model with the strongest simple alternative evaluated. Here paragraph length is associated with era, so a length-only rule provides an important comparison. The model’s mean speech-split accuracy exceeds that rule by about 16.3 points. The text features therefore contribute beyond paragraph length alone.
Show the plotting code
source("R/lesson-figures.R")

plot_data <- study |>
  filter(task %in% c("era", "party")) |>
  mutate(
    task = recode(task, !!!task_labels),
    split_scheme = factor(split_scheme, levels = split_levels)
  ) |>
  select(task, split_scheme, replicate, accuracy, train_majority_accuracy, length_rule_accuracy) |>
  pivot_longer(
    cols = c(accuracy, train_majority_accuracy, length_rule_accuracy),
    names_to = "measure",
    values_to = "score"
  ) |>
  mutate(
    measure = recode(
      measure,
      accuracy = "model",
      train_majority_accuracy = "training-majority rule",
      length_rule_accuracy = "paragraph-length rule"
    )
  )

mean_scores <- plot_data |>
  summarise(score = mean(score), .by = c(task, split_scheme, measure))

measure_colours <- c(
  "model" = lesson_colours[["accent"]],
  "training-majority rule" = lesson_colours[["contrast"]],
  "paragraph-length rule" = lesson_colours[["support"]]
)
measure_label_colours <- c(
  "model" = lesson_text_colours[["accent"]],
  "training-majority rule" = lesson_text_colours[["contrast"]],
  "paragraph-length rule" = lesson_text_colours[["support"]]
)

# The y scale is left to the data. Fixing the lower bound at 0.3 would drop the
# two replicates where the training-majority rule scores 0.27, and those
# are exactly the cases worth seeing: the rule collapses when the class that was
# largest in training is the smaller one in test.
ggplot(plot_data, aes(x = split_scheme, y = score, colour = measure)) +
  geom_point(
    alpha = 0.35,
    size = 1.5,
    position = position_jitter(width = 0.08, height = 0, seed = 4401)
  ) +
  geom_line(
    data = mean_scores,
    aes(group = measure, linetype = measure),
    linewidth = 0.9
  ) +
  geom_point(data = mean_scores, size = 2.6) +
  ggrepel::geom_text_repel(
    data = mean_scores |>
      filter(split_scheme == last(split_levels)),
    aes(label = measure, colour = I(measure_label_colours[measure])),
    direction = "y",
    hjust = 0,
    nudge_x = 0.3,
    segment.colour = NA,
    family = lesson_font,
    size = 3.4,
    seed = 4402
  ) +
  facet_wrap(vars(task)) +
  scale_colour_manual(values = measure_colours, guide = "none") +
  scale_linetype_manual(
    values = c(
      "model" = "solid",
      "training-majority rule" = "22",
      "paragraph-length rule" = "42"
    ),
    guide = "none"
  ) +
  scale_x_discrete(expand = expansion(add = c(0.3, 2.1))) +
  scale_y_continuous(labels = scales::label_number(accuracy = 0.01)) +
  labs(
    title = "Era accuracy is higher for the model than for both rules. The party comparison is less clear.",
    subtitle = "Accuracy in 10 replicates per split scheme. Lines join the replicate means.",
    x = "Split scheme",
    y = "Accuracy"
  ) +
  theme_lesson(grid = "y")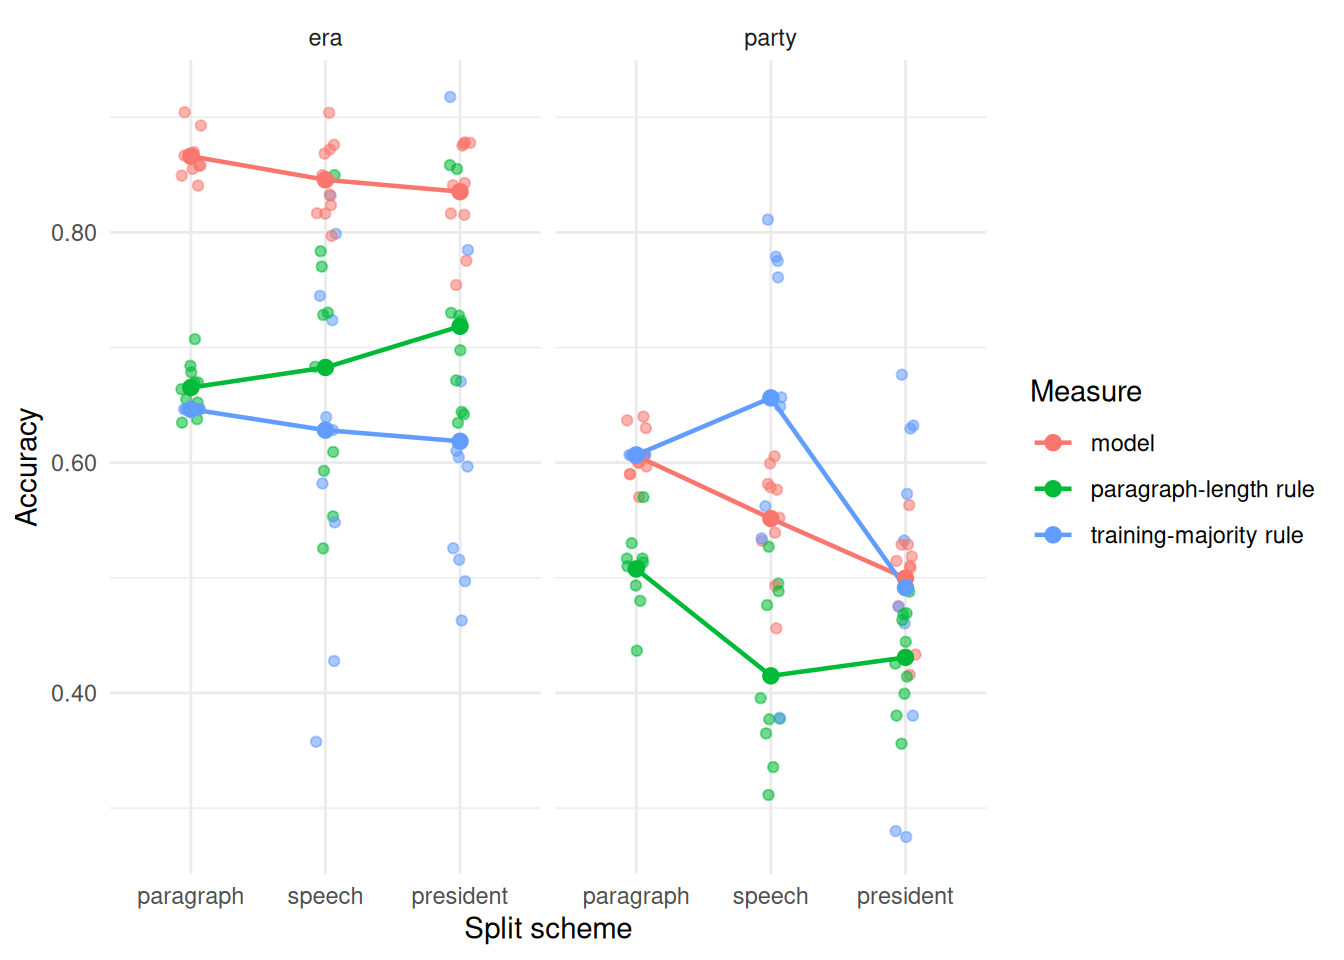
At the paragraph split, the party model does not perform better than its deployable majority rule on average. The mean is 0.606 for the model against 0.6067 for the rule. Across the 10 paired replicates, model accuracy is higher in 3, equal in 1, and lower in 6. At the speech split, the model averages 0.5514 against 0.6563.
Under the person split, accuracy is 0.4997 and mean balanced accuracy is 0.509. The replicate balanced-accuracy values range from 0.4769 to 0.5595. That range includes values below and above the theoretical two-class chance value of 0.5. The conclusion concerns this model: this penalty, recipe, and row set did not consistently predict party correctly.
The controlled comparison is smaller
The era and party tasks are not a clean pair by default. Party keeps only the Democratic and Republican speeches, which leaves 1197 of the full 1377 paragraphs. The dropped rows are from other party labels, and those rows are concentrated in the earliest speeches with longer paragraphs.
The controlled comparison is era_party_rows, which uses the era label on the same rows as the party model. On the full era corpus, model accuracy is higher than the deployable rule’s accuracy in all 10 speech-level replicates. On the party-row subset, the model averages 0.824 against 0.8086 for the training-majority rule. Model accuracy is higher in 6 paired replicates and lower in 4. The mean gap is only 1.5 points because this subset is much more imbalanced, and its direction is not stable across splits.
The full-row results provide evidence for era prediction by this model. The model does not consistently predict party correctly. The controlled subset provides weaker evidence for era prediction.
For era_party_rows under the person split, replicate 3 has undefined balanced accuracy because the test set has only one class. Its test-majority rate is 1, so the accuracy for that one replicate is not a two-class result. The summary table uses na.rm = TRUE for balanced accuracy and reports the missing count so the case stays visible.
Read the final confusion matrix
Sensitivity is the share of before 1900 paragraphs assigned to that first factor level. Specificity is the share of 1900 or later paragraphs assigned to the second level. Naming the event level matters because reversing the factor levels reverses which class each measure describes.
source("R/inaugural-corpus.R")
paragraphs <- inaugural_paragraphs()

set.seed(4301)
era_split <- group_initial_split(paragraphs, group = speech_id, prop = 0.75)
era_training <- training(era_split)
era_testing <- testing(era_split)

era_recipe <- recipe(era ~ paragraph, data = era_training) |>
  step_tokenize(paragraph) |>
  step_stopwords(paragraph) |>
  step_tokenfilter(paragraph, max_tokens = 500) |>
  step_tfidf(paragraph)

era_model <- logistic_reg(penalty = 0.01, mixture = 0) |>
  set_engine("glmnet")

era_workflow <- workflow() |>
  add_recipe(era_recipe) |>
  add_model(era_model)

set.seed(4302)
era_fitted <- fit(era_workflow, data = era_training)

era_predictions <- predict(era_fitted, era_testing) |>
  bind_cols(era_testing |> select(era))

final_training_majority <- era_training |>
  count(era, sort = TRUE) |>
  slice(1) |>
  pull(era)
final_split_baseline <- mean(era_testing$era == final_training_majority)

confusion <- conf_mat(
  era_predictions,
  truth = era,
  estimate = .pred_class
)
confusion_table <- as.data.frame(confusion$table) |>
  as_tibble()

metric_table <- metric_set(accuracy, bal_accuracy, sens, spec)(
  era_predictions,
  truth = era,
  estimate = .pred_class
) |>
  select(.metric, .estimate) |>
  bind_rows(
    tibble(
      .metric = "training_majority_accuracy",
      .estimate = final_split_baseline
    )
)| Prediction | Reference label | Paragraphs |
|---|---|---|
| before 1900 | before 1900 | 145 |
| 1900 or later | before 1900 | 50 |
| before 1900 | 1900 or later | 10 |
| 1900 or later | 1900 or later | 130 |
| Measure | Value |
|---|---|
| accuracy | 0.8209 |
| bal_accuracy | 0.8361 |
| sens | 0.7436 |
| spec | 0.9286 |
| training_majority_accuracy | 0.4179 |
The model gives correct labels to 145 early-era paragraphs and misses 50 of them. It gives correct labels to 130 later-era paragraphs and misses 10 of them. Balanced accuracy is 0.8361, which gives both classes equal weight. The model accuracy is 0.8209. The deployable training-majority rule scores 0.4179 on these same rows.
What else could produce this score
Era is a deterministic function of year, and year is constant within a speech. The era study has 60 independent speech units, not 1377 independent paragraphs. The speech split averages about 14.7 speeches per test set. That is why the model range across speech splits is 0.1069, not the tighter range one might expect from hundreds of independent rows. The 10 replicates describe resampling variability within one corpus. They do not provide a confidence interval for political speech outside this collection.
The next lesson prints this model’s largest coefficients. The earlier-era terms mainly reflect formal register, the vocabulary of a particular style of nineteenth-century public address. They do not necessarily indicate subject matter.
Terms associated with the later era include industrial, economic, international, and federal. Those terms more directly reflect differences in subject matter. The score therefore combines style and subject information, but this analysis does not separate their contributions. Transcription and typesetting conventions can also differ between nineteenth- and twenty-first-century texts. This page does not distinguish those effects from style or subject.
The lesson provides evidence for the limited claim that this text permits era prediction. It does not establish that the model learned what a period was about. Separating period vocabulary from register requires further analysis, such as a stylometric model or a paragraph-length-matched subsample.
When a model grades another model
Generated text rarely has one correct answer, so many projects use a language model to score other outputs. Large comparisons find strong agreement with people on some tasks and weak agreement on others. Judges can also favour answers because of their position in the prompt or their length.
Before using judge scores, compare them with human ratings on a random sample from your task. Reverse the order of the answers in comparisons. Report agreement with a chance-corrected statistic such as Cohen’s kappa. The guide Using a language model in a reproducible analysis shows the same pattern of checks for model labels.
What to remember
- A score with no baseline is hard to interpret.
- Candidate selection must finish before the final test set is opened.
- Group splits need same-split baselines, not only corpus-wide baselines.
- One split gives one number. Repeated splits show the range.
- The score’s meaning depends on the split scheme.
- This text model learned era well. This penalty and feature set did not consistently predict party correctly. That does not establish that party prediction is impossible.
- A language model used as a judge needs the same checks against people.
A useful evaluation states which predictions agree with reference labels and where the evidence stops.
Sources
- yardstick metrics reference
- rsample initial splits
- rsample grouped splits
- rsample grouped V-fold cross-validation
- tidymodels tuning
- tidymodels workflows
- Zheng et al. (2023), Judging LLM-as-a-judge with MT-Bench and Chatbot Arena
- Bavaresco et al. (2025), LLMs instead of human judges? A large-scale empirical study across 20 NLP evaluation tasks