library(dplyr)
library(tidyr)
library(tibble)
library(stringr)
library(tidytext)
library(ggplot2)

source("R/inaugural-corpus.R")
source("R/permutation-null.R")

paragraphs <- inaugural_paragraphs()

speeches <- paragraphs |>
  summarise(text = paste(paragraph, collapse = "\n"), .by = c(speech_id, year, president, party))

speech_tokens <- speeches |>
  select(speech_id, year, president, text) |>
  unnest_tokens(word, text) |>
  filter(str_detect(word, "^[a-z]+$"))

speech_lengths <- speech_tokens |>
  count(speech_id, year, president, name = "total_alphabetic_tokens")

target_words <- c("america", "freedom", "constitution", "children")
min_tokens_for_rate <- 500L

length_context <- speech_lengths |>
  summarise(
    median_alphabetic_tokens = median(total_alphabetic_tokens),
    minimum_alphabetic_tokens = min(total_alphabetic_tokens)
  )

trend_counts <- speech_tokens |>
  count(speech_id, year, president, word, name = "count") |>
  filter(word %in% target_words) |>
  right_join(
    expand_grid(speech_lengths, word = target_words),
    by = join_by(speech_id, year, president, word)
  ) |>
  mutate(
    count = coalesce(count, 0L),
    per_thousand_alphabetic = count / total_alphabetic_tokens * 1000,
    below_min_tokens = total_alphabetic_tokens < min_tokens_for_rate,
    word = factor(word, levels = target_words)
  ) |>
  arrange(word, year)

trend_summary <- trend_counts |>
  group_by(word) |>
  arrange(desc(per_thousand_alphabetic), year, .by_group = TRUE) |>
  reframe(
    total = sum(count),
    speeches_with_word = sum(count > 0),
    max_rate = round(first(per_thousand_alphabetic), 2),
    max_year = first(year),
    max_count = first(count),
    tokens_at_max = first(total_alphabetic_tokens),
    max_rate_flag = if_else(first(below_min_tokens), "under 500 tokens", "ok"),
    rate_excluding_largest = round(max(per_thousand_alphabetic[-1]), 2),
    year_excluding_largest = year[-1][which.max(per_thousand_alphabetic[-1])],
    guarded_rate_excluding_largest = round(
      max(
        per_thousand_alphabetic[-1][
          total_alphabetic_tokens[-1] >= min_tokens_for_rate
        ]
      ),
      2
    ),
    guarded_year_excluding_largest = year[-1][
      total_alphabetic_tokens[-1] >= min_tokens_for_rate
    ][
      which.max(
        per_thousand_alphabetic[-1][
          total_alphabetic_tokens[-1] >= min_tokens_for_rate
        ]
      )
    ],
    survives_guard = max_rate_flag == "ok" & guarded_rate_excluding_largest >= max_rate * 0.5
  ) |>
ungroup()Examining word trends over time
Normalized counts and peak comparisons
signals and discovery
trend detection
inaugural addresses
Learn how to compare word frequency across speeches and find peaks that depend on one short document.
Nia prepares a timeline for a classroom wall. The chart has room for four word-frequency series. Each series must compare speeches of different lengths fairly.
Raw counts tend to be higher in longer speeches. Rates per thousand alphabetic tokens provide a comparable scale. However, one short document can still produce an unusually high rate.
TipWhat you will learn
This lesson shows how to:
- count selected words by speech year.
- normalize word counts per thousand alphabetic tokens.
- put a mark on rates from very short speeches.
- recompute each peak after removing its peak speech.
- compare a peak rate with a length-weighted random baseline.
Count words by speech
A trend is a pattern over time. Counts alone do not prove a trend. Comparable rates reduce the effect of speech length on the comparison.
| Word | Total count | Speeches with word | Max per 1,000 alphabetic tokens | Max year | Count in max year | Alphabetic tokens at max | Max-rate flag | Rate excluding largest | Year excluding largest | Guarded rate excluding largest | Guarded year | Survives guard |
|---|---|---|---|---|---|---|---|---|---|---|---|---|
| america | 166 | 31 | 9.62 | 1993 | 15 | 1559 | ok | 7.41 | 1793 | 6.75 | 1973 | TRUE |
| freedom | 175 | 36 | 12.35 | 2005 | 25 | 2025 | ok | 6.84 | 1957 | 6.84 | 1957 | TRUE |
| constitution | 207 | 39 | 7.41 | 1793 | 1 | 135 | under 500 tokens | 6.65 | 1861 | 6.65 | 1861 | FALSE |
| children | 49 | 22 | 3.11 | 2001 | 4 | 1285 | ok | 2.83 | 1997 | 2.83 | 1997 | TRUE |
The lesson uses four words to illustrate the method. A search across hundreds of words increases the chance of an unusual-looking series. Reporting only those series creates a multiple-comparisons problem: the search makes chance patterns easier to find.
A trend analysis must record the number of words examined. It must account for the number of comparisons or confirm the result on new documents.
The denominator counts lowercase ASCII alphabetic tokens because the tokenizer removes other tokens before measuring speech length. The table reports each word’s count and highest rate on that scale.
The analysis puts a mark on speeches with fewer than 500 alphabetic tokens. One occurrence in those speeches contributes at least 2 occurrences per thousand. The median speech has about 1,959 alphabetic tokens. The cutoff therefore marks the smallest denominators without excluding most speeches.
Plot the trajectories
A line chart shows the sequence across the corpus’s 236 years. Each dot is one speech, and each line connects speeches for one word. Open circles mark rates from speeches under 500 alphabetic tokens.
Show the plotting code
source("R/lesson-figures.R")

plot_data <- trend_counts |>
  mutate(word = factor(word, levels = target_words))

# Without a `word` column, this copy is drawn in every panel as context.
context_lines <- plot_data |>
  rename(context_word = word)

ggplot(plot_data, aes(x = year, y = per_thousand_alphabetic)) +
  geom_line(
    data = context_lines,
    aes(group = context_word),
    colour = lesson_colours[["context"]],
    linewidth = 0.35
  ) +
  geom_line(colour = lesson_colours[["accent"]], linewidth = 0.7) +
  geom_point(
    aes(shape = below_min_tokens),
    colour = lesson_colours[["accent"]],
    fill = lesson_colours[["paper"]],
    size = 1.6,
    stroke = 0.7
  ) +
  scale_shape_manual(values = c(`FALSE` = 16, `TRUE` = 21), guide = "none") +
  facet_wrap(vars(word), ncol = 2) +
  labs(
    title = "Three of the four words reach their highest rate after 1990",
    subtitle = str_c(
      "Occurrences per 1,000 alphabetic tokens in 60 inaugural addresses.<br>",
      "Open circles mark speeches under 500 tokens. Grey lines show the other words."
    ),
    x = "Speech year",
    y = NULL
  ) +
  theme_lesson(grid = "y")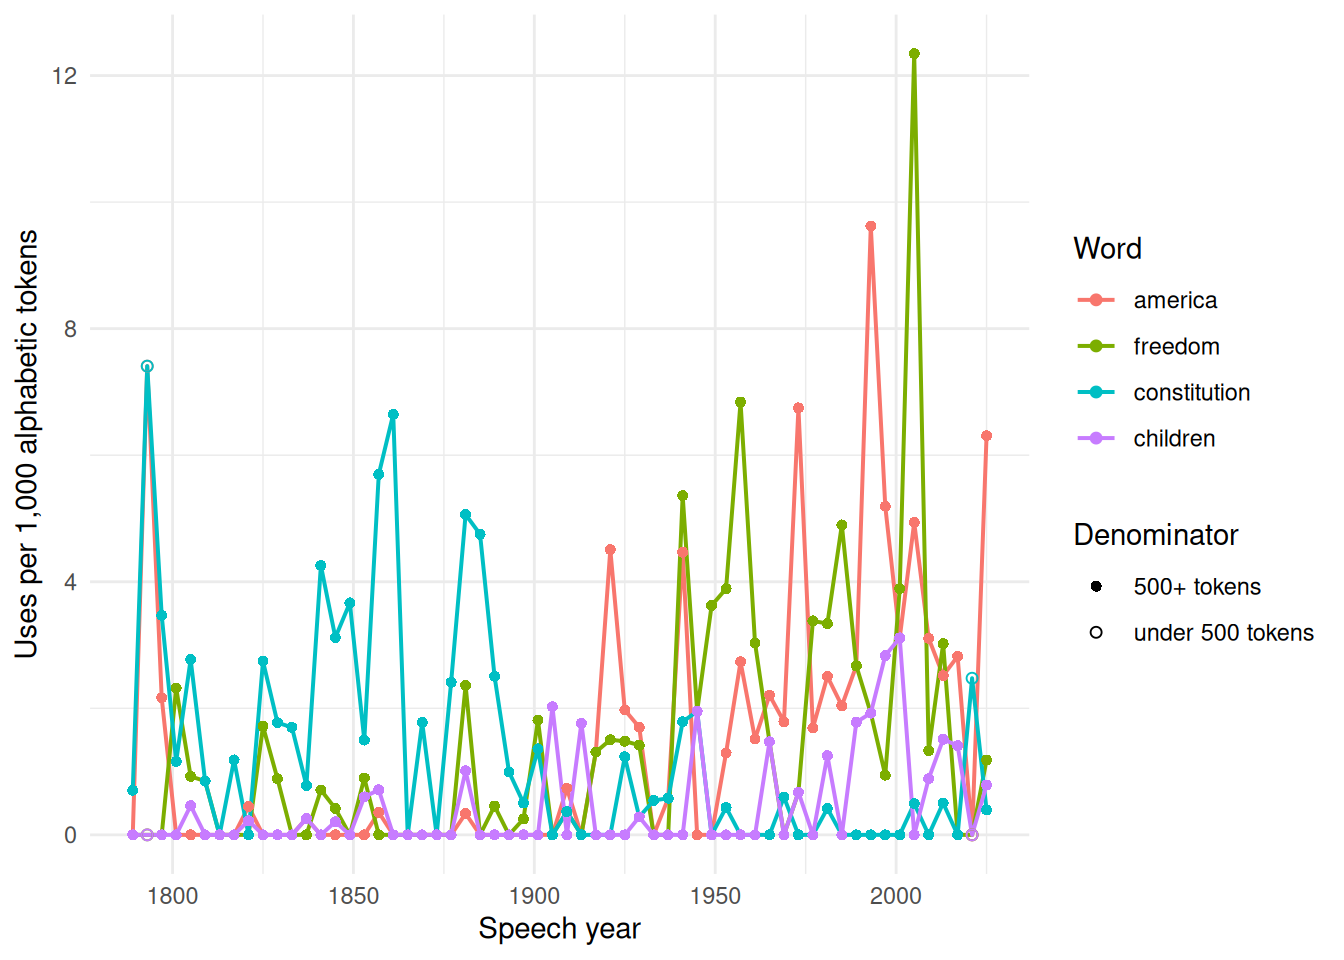
The chart shows word rates rather than causes. A rate increase can reflect different word choices, subjects, transcription conventions, speech lengths, or a combination of those factors. Counts alone do not distinguish those explanations.
Compare the peak with a null model
The largest-contributor check must use the reported statistic. Here that statistic is the peak rate. The analysis recomputes each word’s rate after it excludes the speech with the maximum per-thousand value.
For this random baseline, each word occurrence is assigned to a speech at random. Each speech’s probability is proportional to its number of alphabetic tokens. Assignments are independent, so a speech can receive more than one occurrence. The code makes 1,000 allocations and records the highest rate in each.
The p-value adds 1 to the number of random peaks at least as high as the observed peak. It then divides that sum by the number of random peaks plus 1.
constitution_counts <- trend_counts |>
  filter(word == "constitution")

constitution_peak_null <- permutation_null(
  observed = max(constitution_counts$per_thousand_alphabetic),
  replicate_fn = function() {
    assigned_speeches <- sample(
      seq_along(constitution_counts$total_alphabetic_tokens),
      size = sum(constitution_counts$count),
      replace = TRUE,
      prob = constitution_counts$total_alphabetic_tokens
    )
    random_counts <- tabulate(
      assigned_speeches,
      nbins = length(constitution_counts$total_alphabetic_tokens)
    )
    max(random_counts / constitution_counts$total_alphabetic_tokens * 1000)
  },
  replicates = 1000L,
  seed = 5601L,
  alternative = "greater"
)

constitution_peak_null_display <- constitution_peak_null |>
  mutate(across(c(observed, null_mean, null_low, null_high, p_value), \(x) round(x, 3)))

constitution_top_rates <- constitution_counts |>
  arrange(desc(per_thousand_alphabetic), year) |>
  slice_head(n = 5) |>
  transmute(
    speech_id,
    year,
    president,
    count,
    total_alphabetic_tokens,
    per_thousand_alphabetic = round(per_thousand_alphabetic, 2),
    denominator_flag = if_else(below_min_tokens, "under 500 tokens", "ok")
)| Speech | Year | President | Count | Alphabetic tokens | Per 1,000 alphabetic tokens | Denominator flag |
|---|---|---|---|---|---|---|
| 1793-Washington | 1793 | George Washington | 1 | 135 | 7.41 | under 500 tokens |
| 1861-Lincoln | 1861 | Abraham Lincoln | 24 | 3611 | 6.65 | ok |
| 1857-Buchanan | 1857 | James Buchanan | 16 | 2808 | 5.70 | ok |
| 1881-Garfield | 1881 | James A. Garfield | 15 | 2963 | 5.06 | ok |
| 1885-Cleveland | 1885 | Grover Cleveland | 8 | 1684 | 4.75 | ok |
| Observed | Null mean | Null low | Null high | p-value | Replicates | Alternative |
|---|---|---|---|---|---|---|
| 7.407 | 5.314 | 3.42 | 7.426 | 0.233 | 1000 | greater |
The problem is visible for constitution. Its maximum rate is 7.41 per thousand alphabetic tokens in 1793. That speech has only 135 alphabetic tokens, so one occurrence creates the peak.
After removal of that speech, the next rate is 6.65 in 1861. The original peak fails the denominator guard because its document contains fewer than 500 tokens.
Random allocation of the 207 occurrences across fixed speech lengths gives a null mean of 5.31. The 90% interval is 3.42 to 7.43, with p = 0.233. The observed 1793 peak is within the range that this allocation can produce.
Trend methods produce a series for the chosen words and dates. The null allocates the same number of word occurrences across speeches in proportion to speech length. It measures the resulting peak without the observed time pattern.
What to remember
- Normalize word counts per thousand alphabetic tokens before comparing speeches.
- Put a mark on rates from very short documents. This lesson uses a 500-token cutoff.
- The four tracked words have different coverage across the 60 speeches.
- The
constitutionpeak in 1793 comes from 1 occurrence in a 135-word speech. - Word-rate change can mix word choice, subject matter, transcription, and length.
Use trend charts to find patterns for closer reading. Compare those patterns after excluding the largest contributor.