Model records, human labels, and estimates corrected for model errors
guide
language models
reproducibility
evaluation
Use a local language model to give text labels. Compare its labels with a person’s labels on a random sample. Correct an estimate for model errors.
Ruth has the 240 records from the Calder Yard review in lesson 74 and a report to write. A small language model could read every record in an afternoon. Ruth needs the share of responsive records: records relevant to the review request. She also needs to describe the uncertainty in that estimate.
This page uses a language model as a measurement instrument, a tool that gives labels for an analysis. The researcher records the instrument before the first execution and saves its outputs. Reviewers examine a random sample. The final estimate includes a correction for the errors found in that sample. These steps apply to hosted models, local models, and trained classifiers.
Note
The records are the constructed review collection from lesson 74. The page author wrote these fictional teaching records and their reference labels together. Here the reference labels represent the labels that a person would give after careful checks.
TipWhat you will learn
This page shows how to:
Decide when to use a language model for a text task.
Record a model run so another person can execute it again.
Use saved outputs as the record.
Use reruns for a reproducibility check.
Compare model labels with a person’s labels on a random sample.
Correct an estimate for model errors with that sample.
Find R tools for this method.
Decide whether a language model is the right instrument
Language models can annotate, classify, extract, and summarize text well enough for some research tasks. Annotation gives labels to text. On some annotation tasks, models match or exceed crowd-worker performance at a small fraction of the cost. Replications also find inconsistent performance. The same model can perform well on one dataset and poorly on another. Small changes to a prompt’s wording or format can change accuracy by many points.
Three findings inform this advice. First, models follow a written codebook more consistently than a category name alone. A codebook gives category definitions and explains difficult cases. The codebook matters more than clever prompt wording.
Second, a small model fine-tuned on a few hundred labelled examples often matches or exceeds a prompted large model on a stable task. The small model can cost less and produce more stable output. Third, labels are inputs to an analysis, not findings. Even labels that usually agree with reviewers can introduce bias, a systematic error in an estimate. Their errors are rarely random.
The earlier lessons still apply. A model does not replace corpus design (lesson 4), a defined unit of analysis, or held-out evaluation (lesson 44). It replaces one coder, a person who gives labels. Its labels also need checks.
Record the instrument before you use it
An instrument record lists the settings that control the model’s output. Here it contains the model, its exact revision, the prompt, and the decoding settings. Decoding is the procedure that selects output tokens. The prompt is in a file with a fingerprint, a value calculated from the file’s contents to detect changes.
The author wrote the prompt from the review request alone, before the model processed any record. The author read the model’s answers but did not revise the prompt.
You review records for one legal request. Follow the codebook. Reply with one word: yes or no.

Request: {request}

Codebook:
- Answer yes when the record is about hiding safety inspection delays, changing inspection logs, or deleting inspection-related messages for the Calder Yard contract. Vague or indirect wording that asks someone to keep an inspection problem out of a document counts.
- Answer no when the record is about other work, even if it mentions an inspection, a log, or a delay.

Record: {record}

Is this record responsive to the request? Answer yes or no.
The model has public weights and uses a fixed revision. The runtime compares each listed model file with its recorded SHA-256 fingerprint before it loads the model. A manifest lists the expected model files. A hosted provider can change a model but keep its name. It can also remove the model. A hosted run therefore needs the dated model version and a saved copy of every answer.
Save labels and raw outputs
The builder script data-raw/build-llm-review-labels.R sent this prompt once per record to the model at its fixed revision. It saved every raw answer with the run’s metadata. Rendering this page reads that saved run. It does not give the collection new labels. The saved file records what the model said. A rerun provides a check on that record, not a replacement for it.
Before the page uses saved labels, it makes sure that they match the instrument record. A change to the prompt, model, decoding settings, or collection fails the check. The page then stops. It does not report labels from a different run.
labels_path <-"data/riverton/riverton-llm-review-labels.csv"cached_labels <-read_csv( labels_path,na =character(),col_types =cols(doc_id =col_character(),raw_output =col_character(),llm_label =col_character(),output_tokens =col_integer(),ended_by_eos =col_logical() ))run_record <-read_csv("data/riverton/riverton-llm-review-labels-metadata.csv",na =character(),col_types =cols(.default =col_character()))decoding_settings <-paste("greedy; do_sample = FALSE; num_beams = 1; max_new_tokens = 3;","repetition_penalty = 1")parse_answer <-function(raw_output) { first_word <-str_extract(str_to_lower(raw_output), "[a-z]+")case_when( first_word =="yes"~"responsive", first_word =="no"~"not responsive",TRUE~"unparsed" )}cache_checks <-tibble(check =c("labels file matches its recorded fingerprint","prompt file and prompt ID match the run","review collection matches the one that received these labels","model ID and revision match the pinned manifest","decoding settings match this page","every saved label matches its raw answer" ),passed =c(hash_lines(labels_path) == run_record$fingerprint,hash_lines(prompt_path) == run_record$prompt_sha256 && prompt$prompt_id == run_record$prompt_id,hash_lines(collection_path) == run_record$collection_sha256, run_record$model_id == model_record$model_id && run_record$revision == model_record$revision, run_record$decoding == decoding_settings,all(parse_answer(cached_labels$raw_output) == cached_labels$llm_label) ))
Comparison of the saved run with the instrument record
Checks on saved labels
Passed
labels file matches its recorded fingerprint
TRUE
prompt file and prompt ID match the run
TRUE
review collection matches the one that received these labels
TRUE
model ID and revision match the pinned manifest
TRUE
decoding settings match this page
TRUE
every saved label matches its raw answer
TRUE
Details recorded by the builder when it gave the collection labels
R version 4.6.1 (2026-06-24 ucrt); Windows 11 x64 (build 26200); Python 3.12.10; torch 2.9.1+cpu; transformers 4.57.6
seconds_per_record
23.16
The model answered yes for 14 records and no for 226. Every answer began with one of the two specified words. The page uses a rule chosen in advance for all other answers. Each counts as not responsive because the model did not say the record was responsive.
Process a few records again for a reproducibility check
Greedy decoding selects the single most likely token at each step. The same software on the same machine usually produces the same answers. Small numerical differences between machines, library versions, or server batch sizes can change a selection. On a hosted service, “temperature 0” does not guarantee identical answers.
The check below processes eight records again. It selects records with seed 925, the date the author wrote the prompt. It compares the new answers with the saved answers.
Use the front tablet for badge photos this week because the kiosk camera flickers. Call me if anything is unclear.
no
no
TRUE
RYD-0167
Chat at noon: The inspector role in the training exercise is assigned to Marcus.
no
no
TRUE
RYD-0026
Forwarding from intake: The Room 104 sink repair note belongs in the maintenance binder.
no
no
TRUE
RYD-0047
Per scheduling: Move the translation cards to the library event folder with the bilingual flyers.
no
no
TRUE
RYD-0179
Reminder: Move the spare chargers beside the loaner laptop case after checking their labels.
no
no
TRUE
RYD-0004
Forwarding from intake: Please refill the badge sleeves before the Tuesday visitor group arrives, then restock the reception tray.
no
no
TRUE
RYD-0076
Please note: Keep the rough yard timeline out of the shared packet today.
no
no
TRUE
RYD-0116
Reminder: Move the donated coats to the storage room this afternoon and keep adult sizes separate.
no
no
TRUE
In this render, 8 of 8 rerun answers match the saved answers exactly. The page does not require all eight to match. Answers can differ on a different computer. The page reports the result. The estimates below use the saved answers whether the new answers match or not.
Compare the model’s labels with a person’s labels on a random sample
A person now examines a simple random sample of 40 records. Every record has the same chance of selection. The author fixed the seed, 2509, before the first selection. The code selects the sample once. Random selection permits conclusions about the whole collection. A sample of hand-picked or easy records would not permit those conclusions.
Model labels compared with the person’s labels in the random sample
Person’s reading
Model says not responsive
Model says responsive
not responsive
33
0
responsive
4
3
The model and the person agree on 36 of the 40 records in the sample. Agreement alone does not show the direction of the errors. Here the model missed 4 responsive records. No record that the person called not responsive had a responsive model label. A count of the model’s responsive labels is therefore too low.
Calculate the responsive share with a correction for model errors
Three estimates of the responsive share are possible:
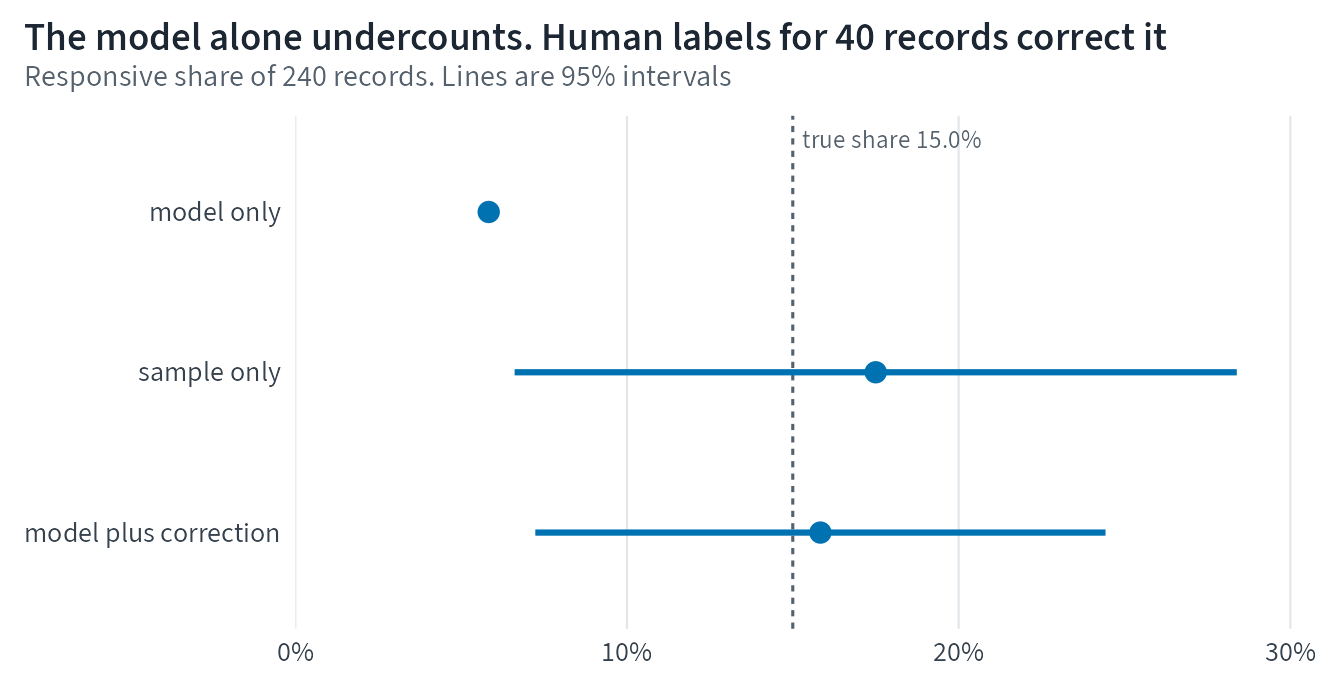
Model only: the share of all 240 records the model called responsive. This estimate uses every record but includes every model error.
Sample only: the share of the 40 records in the sample that the person called responsive. This estimate is unbiased but uncertain because 40 records is a small sample.
Model plus correction: the model-only share plus an error correction. The correction is the average difference between the person’s reading and the model’s label in the sample. This difference gives an estimate of the model’s average error. The correction removes that estimated error.
The third estimate is the difference estimator from survey sampling. In machine learning, prediction-powered inference uses the same idea. The estimator is unbiased over repeated random samples. Its precision depends on variation in the difference between human and model labels across records. When the model agrees with reviewers on most records, the interval is narrower than an interval from the sample alone.
Each interval below is the estimate plus or minus 1.96 standard errors. The calculation includes the finite-population correction for a sample of 40 from 240 records.
Three estimates of the responsive share of the collection
Method
Estimated responsive share
95% interval
Uses
model only
5.8%
none: no sampling, but the model’s bias remains
model labels for all 240 records
sample only
17.5%
6.6% to 28.4%
the person’s labels for 40 records
model plus correction
15.8%
7.2% to 24.4%
model labels for all 240 records and the person’s labels for 40
The constructed collection has a known true share: 15.0%. A real project would not have this number. The page shows the true share only to compare the three methods.
Figure 1: Three estimates of the responsive share, with 95% intervals, against the true share known only because the collection is constructed.
Select more samples to examine the correction
One sample can give an unusually good estimate. The code selects 2,000 more samples of 40 records, with no new model calls. These samples show each method’s behavior over repeated selections. For each sample, the code calculates both sample-based estimates again. It then shows whether each interval contains the true share.
Two sample-based estimators over 2,000 repeated samples of 40 records
Method
Average estimate
Average interval width
Intervals that contain the true share
sample only
15.2%
20.1 points
96.2%
model plus correction
15.2%
16.1 points
92.4%
Both methods average close to the true share. Corrected intervals have an average width of 16.1 percentage points. Sample-only intervals average 20.1 percentage points. Corrected intervals are narrower because the model’s labels agree with the person’s labels on most records. The sample therefore must measure only the model’s errors.
Corrected intervals contain the true share in 92.4% of samples. This is slightly below the nominal 95%. Sample-only intervals contain it in 96.2% of samples. The simple normal-approximation interval causes this shortfall. This approximation is imprecise when the model’s misses are rare in a sample of 40.
In 20 of the 2,000 samples, the sample contained no missed records. The corrected interval therefore had zero width. A larger sample, or an interval designed for rare events, would correct this shortfall.
A checklist for model-assisted analysis
Choose the instrument for the task. Prefer a rule, a dictionary, or a small trained model when it meets the need. Use a language model when the task needs text interpretation that these tools cannot provide.
Write the codebook and prompt before the first run. Store them in a file. Record the file’s fingerprint.
Use a fixed model revision. Record the model name, exact revision or dated version, decoding settings, and software versions. Public weights that you can execute locally make this easier. They do not remove every source of variation.
Save every raw output with the ID of the input that produced it.
Process a sample again. Report how many answers are identical.
Compare model labels with a person’s labels on a random sample. Report both kinds of error.
Correct estimates that use model labels. Use the difference estimator or a related method, such as prediction-powered inference or design-based supervised learning.
Examine a judge model in the same way before you trust its scores.
Examine structured output for content as well as format. A reply that matches a schema can still contain wrong values.
Read code that an assistant wrote. Execute the code again. Keep a reference calculation for important numbers. Use fixed software versions.
Disclose the model’s role with a reporting checklist such as GUIDE-LLM or TRIPOD-LLM.
R tools for this way of working
The project examined these packages on 25 September 2026. Versions change often. Examine the current documentation before you use a package.
R packages for model-assisted text analysis, examined 25 September 2026
Package
What it does
Runs with local models
ellmer 0.5.0
Chat with model providers, call tools, and extract structured data
Yes, through Ollama
mall 0.2.0
Classify, extract, or score a data frame column row by row
Yes, designed for Ollama
ragnar 0.3.1
Chunk documents, store embeddings, and retrieve passages
Partly. Document conversion uses Python
vitals 0.4.0
Evaluate model-based tools with model-graded scoring
Yes, with any ellmer chat
tidyllm 0.6.0
One tidy interface to several providers
Yes, through Ollama
ipd 0.4.1
Inference on predicted data, with prediction-powered inference
Not needed. It uses saved labels
huggingfaceR 2.1.0
Hugging Face models through Python, used on this site
Yes, fully offline once models are saved
The reference implementation of design-based supervised learning is the dsl package on GitHub, which is not on CRAN.
What to remember
Record the model, revision, prompt, and settings before you use the model.
The saved outputs are the reproducible record. A rerun provides a check on that record.
A random sample examined by people shows model errors.
Correct estimates with that sample. Model-only numbers retain the model’s bias.
The earlier lessons’ rules still apply. Keep provenance, stable IDs, baselines, and held-out evaluation.
Ruth’s report gives the corrected share, its interval, the sample, and the instrument record. Readers can examine each step.